


1. Introduction
Glaciogenic cloud seeding, a weather modification technique aimed at enhancing precipitation by seeding clouds with silver iodide (AgI), has garnered significant attention as a potential tool to address water scarcity and mitigate drought impacts in various regions worldwide (Pokharel et al. 2017; Rauber and Blanchard 2007; National Research Council 2003). This innovative approach holds promise for augmenting precipitation in mountainous areas, where water resources are vital for ecosystems, agriculture, and urban populations (Rauber and Blanchard 2007). Cloud seeding operations have a long history in Utah and across the Mountain West region of the United States (Breed et al. 2014); however, the scientific understanding of cloud seeding and meteorological intervention remains limited (Rauber et al. 2019; DeFelice 2018)
The history of glaciogenic cloud seeding stretches back several decades, with early experiments dating back to the mid-20th century (Cooper 1985). In the United States, Utah has been at the forefront of cloud seeding research and operational implementation, spearheading efforts to evaluate the effectiveness of cloud seeding as a water management strategy (Griffith et al. 2022). The state’s arid climate and reliance on mountain snowpack for water supply make it an ideal testing ground for cloud seeding initiatives (Pokharel et al. 2021). Over the years, numerous cloud seeding projects have been conducted in Utah, utilizing various seeding techniques and targeting specific weather conditions to maximize precipitation enhancement (Pokharel et al. 2021).
Furthermore, there are widespread cloud seeding operations across the Mountain West region of the United States, encompassing states such as Colorado, Wyoming, Idaho, and Montana (Tessendorf et al. 2020; Friedrich et al. 2021; Pokharel and Geerts 2016; Breed et al. 2014; French et al. 2018). These initiatives, often conducted by water management agencies, research institutions, and private entities, aim to bolster snowpack levels, enhance water availability, and mitigate the impacts of drought on local communities and ecosystems (Rauber et al. 2019). The Mountain West’s complex terrain and diverse meteorological conditions present unique challenges and opportunities for cloud seeding, prompting ongoing research and operational efforts to optimize seeding techniques and assess their efficacy in different geographic and climatic contexts (Rauber et al. 2019).
Glaciogenic cloud seeding, a technique designed to enhance precipitation by introducing additional ice nuclei into clouds, demonstrates high efficacy when abundant liquid water (LW) is present within clouds at temperatures below approximately -5°C (Pokharel et al. 2017; Pokharel and Geerts 2016). However, accurately measuring LW poses a significant challenge, particularly when considering larger areas, as point measurements may fail to represent the variability observed over complex terrain affected by wind, turbulence, and cloud dynamics (Hobbs and Rangno 1979). Furthermore, weather forecasting models encounter difficulties in simulating LW due to their inability to accurately capture boundary layer turbulence over mountainous regions, where air motion exhibits considerable variation (Kringlebotn et al. 2011). The selection of appropriate model schemes and boundary conditions further complicates LW forecasting, as certain physics schemes excel in temperature prediction while others perform better in forecasting precipitation and cloud water content (Bannister et al. 2020). Therefore, addressing these challenges in LW measurement and forecasting accuracy is crucial for optimizing the effectiveness of glaciogenic cloud seeding operations, particularly in regions characterized by complex terrain and dynamic meteorological conditions.
This study evaluates the presence of LW over the two sides (south and north) of the Uinta Mountain Range based on radiometer observation and compares the measurements with high resolution WRF model forecast data. This is the first model verification work of LW over the mountains in Utah. Continuous improvement of the model is essential, and observations play a critical role in this process. Observational datasets are used not only to evaluate model performance in forecasting LW, but also to identify systematic biases and inform improvements to model physics and parameterizations. Because accurate LW forecasts are crucial for cloud seeding operations and a dense observational network is not feasible across all of Utah, the model can be effectively utilized if the forecast accuracy meets the operational requirements for cloud seeding.
2. Study Area, Data and Methods
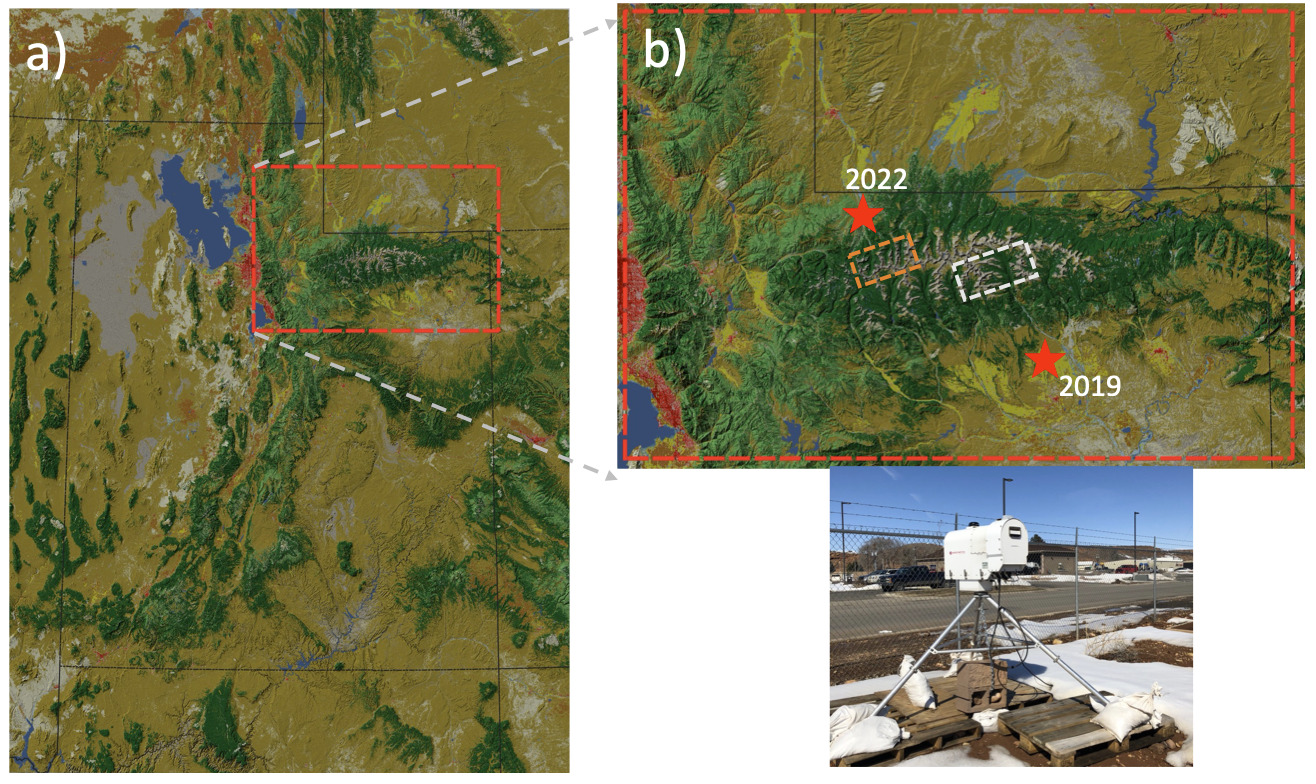
This study focused on the Uinta Mountains, where a radiometer was employed to measure cloud LW, crucial for glaciogenic cloud seeding. Both the northern and southern sides of the Uinta range were targeted for cloud seeding, with LW measurements obtained for both sides, as illustrated in Figure 1.
_and_the_uinta_range_(b)__showing_radiometer_deploy.png)
The Utah Division of Water Resources (DWR) installed a radiometer in Roosevelt, Utah, to support operational cloud seeding activities over the Uinta Range during the winter of 2019 (January–March). In the winter of 2022 (January–May), the instrument was relocated to the northern side of the range, where it was operated at 20 degrees elevations targeting north and south directions. The radiometer also collected vertically pointing measurements to derive the vertical profiles of cloud LW. The data availability period is shown in Figure 2.
This is a unique dataset that includes vertically integrated liquid water path (LWP) observations from both the southern and northern sides of the Uinta Mountains. As most storms approach from the south, with a smaller number originating from the north, these observations provide valuable insight into the frequency and magnitude of LWP on both sides of the range. Although the measurements were not conducted simultaneously during the same winter season, the dataset enables a useful comparison of cloud liquid water characteristics across the two mountain flanks.
Radiometer data collected during both seasons underwent processing using Radiometrics software to produce final version (level 2) datasets, forming the foundation of analysis in this study. These datasets include measurements of both LWP and liquid water content profiles, offering valuable insights into cloud microphysical properties and their variations over the study area. Additionally, LWP was calculated using the liquid water profile data from the radiometer measurements to compare with existing LWP data derived from the Radiometrics software. In addition to radiometer data, this study integrates forecast data from the Weather Research and Forecasting (WRF; Skamarock et al. 2008) model for the 2018/2019 and 2021/2022 winter seasons. These forecast data, aligned with the area covered by radiometer measurements, allow for a comprehensive analysis of cloud liquid water dynamics and the performance of the WRF model in simulating these phenomena. Although not directly related to the primary focus of this study, radiometer and forecast data from the 2018/2019 winter season were also utilized for comparative analysis to shape the final operational configuration of model physics; primarily planetary boundary layer and cloud microphysics. The results and analysis presented here further explore the ability of these “optimized” model physics configuration to capture cloud conditions over the added mountain ranges and the seasonally-unique large-scale synoptic patterns of the 2021/22 season. This comparative approach facilitates the evaluation of the WRF model’s performance in simulating cloud liquid water content across different years, providing valuable insights into the model’s reliability and predictive capabilities.
The WRF model is initialized by 12-km North American Mesoscale (NAM) output with 3-hourly lateral boundary conditions provided over an 84-hour (3.5 day) lead time. The model domain covers the entirety of Utah and into the surrounding states (see Figure 1) and initially (from 2019) operated at a 3 km horizontal resolution with 38 vertical levels; however, shortly after implementation in 2019 the model’s resolution was improved to 2 km horizontal grid spacing and 40 vertical levels. Alongside the implementation of the finer model resolution, the model’s physics options were optimized for cloud conditions during a multi-physics comparison phase using radiometer observations from the 2018/19 season. Many of the model physics options were selected to maintain consistency with the NCEP parent model’s configuration, as this minimizes confounding biases from parameterization designs. However, the primary focus of these comparisons was on cloud microphysics and boundary layer options, as these factor heavily into cloud conditions and boundary layer stability, both of which are critically important for cloud seeding decision-making. For this, we compared a collection of modeled forecast conditions against observations, particularly considering the LWP from radiometer measurements. Model physics configuration skill was assessed by comparing the timing and magnitude of the modeled vs observed presence of cloud liquid water to identify better performing model physics in capturing the timing, duration, and magnitude of cloud conditions. Based on the comparison, the Thompson graupel scheme (Thompson et al. 2008) was chosen for subsequent analyses for cloud microphysics, and MYNN 2.5 level TKE (Olson et al. 2019) for boundary layer physics. The comparison and subsequent refinement of model configurations led to improved WRF forecast performance, strengthening its applicability for operational cloud seeding guidance.
The vertically integrated LWP from the WRF model was averaged within the designated boxes for the two study periods from 2019 and 2022 as shown in Figure 1b and compared with the radiometer-measured LWP. Statistical methods were employed to evaluate the WRF’s performance in predicting the vertically integrated LWP during the two cloud seeding seasons. The methods used for evaluating the WRF LWP are detailed in Tables 1 and 2.
3. Results
3.1. Vertical Profile of LW
The liquid water profile was measured targeting the Uinta Range from the southern side in 2019 and from northern side in 2022. Figure 2 shows the February and March 2019 LW profiles measured from Roosevelt, Utah. The radiometer is pointing north to measure the profile of LW over the Uinta Mountains (Figure 1). Throughout February and March 2019, LW was frequently observed, coinciding with above-normal precipitation measured in Utah during that winter (result not shown). The majority of LW was observed below 3 km above ground level (agl), although in certain cases (early February in the upper panel and later March in the lower panel), LW was observed at higher level.

Four months of data were collected and analyzed from January to April 2022. The radiometer, positioned on the northern side of the Uinta (Figure 1), captured LW profiles from 2022. Figure 3 illustrates these profiles, indicating less frequent LW observed during the 2022 winter season. This reduced LW frequency is consistent with the anomalously low precipitation during the winter of 2021–2022, which was one of the driest winters on record in Utah (results not shown) and was characterized by less frequent storm activity.
Similarly to 2019, the northern side of the Uinta on 2022 primarily observed LW at lower levels (up to 3 km agl), with some higher-level LW in April. Storms with significant LW were sparse in January, with only two observed around January 21 and 24. February saw a few storms, with LW low in the first half but increasing in the second half. The radiometer experienced downtime during March, and although LW was low in the first week and towards the end of the month, some storms were observed. April witnessed several storms, with LW observed around April 5 and in the middle of the month, but a notable amount of LW was observed around April 23-24, indicating a potentially favorable seeding window.

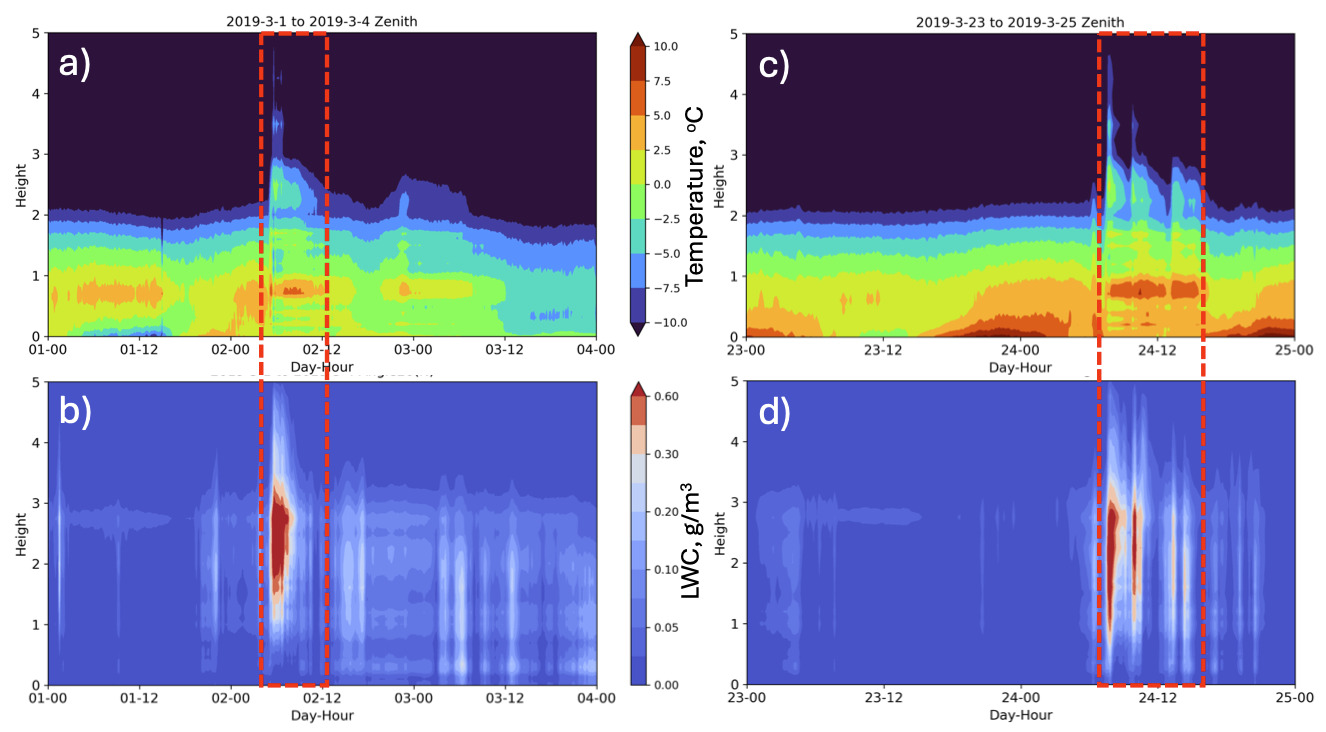
Further analysis of LW content and temperature profiles during selected storm events revealed notable atmospheric features (Figure 4). Two cases characterized by elevated LW values were analyzed to assess the corresponding vertical temperature structures measured by the radiometer. In early March (Figure 4a,b), elevated LW content was detected at higher altitudes, accompanied by a pronounced temperature inversion below 1 km. A similar pattern was observed on 24 March 2019 (Figure 4c,d), with high LW aloft and a distinct inversion layer below 1 km. In both cases, the maximum temperature occurred near 1 km, suggesting a stable layer below. Above this level, the atmosphere became increasingly unstable, likely facilitating convective development and the upward transport of moisture, resulting in enhanced LW content up to 3 km.
_and_lw_(lower_panels)_profiles_from_1_to_3_.png)
3.2. WRF and Observed Liquid Water Path (LWP)
The WRF model has been employed to simulate cloud seeding operations in Utah since 2018. It is initialized four times a day using North American Mesoscale Modeling (NAM) forecast data. Both the radiometer and WRF provide LW profiles, albeit with significantly different data frequencies. The radiometer offers profile data at a 20 degree elevation angle targeting the mountain. As it targets LW measurement over the Uinta range, we utilized profile LW data to calculate the LWP. Despite the radiometer data providing LWP, it contains unrealistically high values and biases that are impossible to eliminate. To validate the model data, realistic LWP data from observations must be obtained, achieved by calculating LWP from scratch using LW profile data through the Python programming language. The same technique is applied for WRF model LWP calculation.
Radiometer data frequency fluctuates from 2 to 5 minutes, whereas the WRF model provides broader spatial coverage but coarser data frequency. Thus, both measurements and models have limitations, but model data can be utilized if it aligns with observations. This section primarily focuses on comparing WRF model forecasts with observations, concentrating on LWP.
To align data frequency, radiometer LWP is interpolated (averaged) to 3-hourly data for comparison with model data. The comparison of LWP during February and March 2019 from observations and forecasts is depicted in Figure 7. The model forecast accurately predicted LWP during major storms in February (Figure 5a); however, during periods of low LWP (2-21 February), the model underestimated compared to observations. Additionally, the model overpredicted in some instances, notably around the 19 February storm where observed values were considerably smaller. Similarly, the WRF model accurately captured major storms, predicting LWP at the correct times in March (Figure 5b). Notably, the model predicted smaller LWP during the earlier period (around 1-5 March, Figure 5b), but consistently overpredicted LWP compared to observations for most days, consistent with February. It’s important to note that measurements and model data are from the southern slope of the Uinta range.
_from_radiometer_measurements_(d.svg)
Further evaluation of WRF forecasts considered radiometer measurements from January to April 2022. The radiometer, targeting the northern slope of the mountains, was installed on January 20th, with data available from January 21st and for entire months thereafter. However, the instrument encountered some errors during measurements, resulting in gaps in observational data as seen white area in Figure 3. LWP data from the radiometer and WRF model forecast are depicted in Figure 6. In January (Figure 6a), observed values were significantly larger than WRF forecasts, although the model did predict LWP, albeit smaller values. The WRF forecast performed better in February (Figure 6b), with model values comparable to the observed LWP for the first half of the month. However, observed values surpassed model data in the second half of February, with the model failing to capture observed LWP after February 22nd. March (Figure 6c) displayed a similar trend to February’s latter half, with observed LWP values surpassing WRF forecasts. In April (Figure 6d), the WRF model successfully captured all storms, with observed and forecasted LWP values largely aligned, though most radiometer values were larger than the forecast.
_from_radiometer_measurements_(d.svg)
3.3. Statistical Analysis
The observed and forecasted LWP values were compared using standard statistical metrics, as summarized in Table 1. Daily averaged values from both observations and the Weather Research and Forecasting (WRF) model were used for analysis, as these statistical tools are most effective for daily datasets. An initial qualitative comparison categorized LWP detection under four conditions: a) both radiometer and WRF forecast showed LWP (yes, yes), b) neither WRF nor radiometer showed LWP (no, no), c) radiometer measured LWP but WRF did not forecast (yes, no), and d) radiometer did not measure LWP but WRF forecasted (no, yes) as given in Table 2.
The comparison for 2019 (Table 3) indicates that WRF predicted LWP on most days, correctly forecasting 31 events and missing 11. There were also four days when WRF falsely forecasted LWP in the absence of radiometer detection. In contrast, the 2022 results show a higher frequency of missed events by WRF when LWP was observed by the radiometer. It is important to note that Radiometrics did not calibrate the neural network for the correct location and elevation until February 10, 2022, which may have affected data quality prior to this date. Therefore, only data from February 11, 2022, onward were considered for comparison with observed data, particularly for the forecast verification results presented in the following section.
Further evaluation using additional statistical metrics is presented in Table 4. The WRF model exhibited a consistent bias score (0.8 in 2019 and 1.13 in 2022, ideal value is expected to be close to zero), and the probability of detection was 0.7 (ideal = 1). In contrast, the false alarm ratio remained low, at 0.1 in 2019 and 0.31 in 2022—close to the optimal value of zero in 2019 but higher in 2022. Moreover, the threat score (TS) and Heidke skill score (HSS)—for which values closer to one indicate better performance—are higher in 2019 than in 2022 (Table 4). This suggests that the model struggled more to forecast LWP during northerly flow conditions (2019 radiometer measurements) than during southerly flow conditions (2022 radiometer measurements). Nevertheless, these results indicate that although the model performs reasonably well in detecting the presence or absence of LWP, it has limitations in accurately predicting LWP magnitudes.
4. Discussion
The WRF forecast shows good to fair agreement with radiometer-derived LWP on both sides of the mountain range at the temporal scale. However, liquid water can vary substantially over complex mountainous terrain, where boundary-layer turbulence plays a critical role in LWP development, as previously observed over the mountains of Wyoming (Pokharel et al. 2014; Pokharel and Geerts 2016).
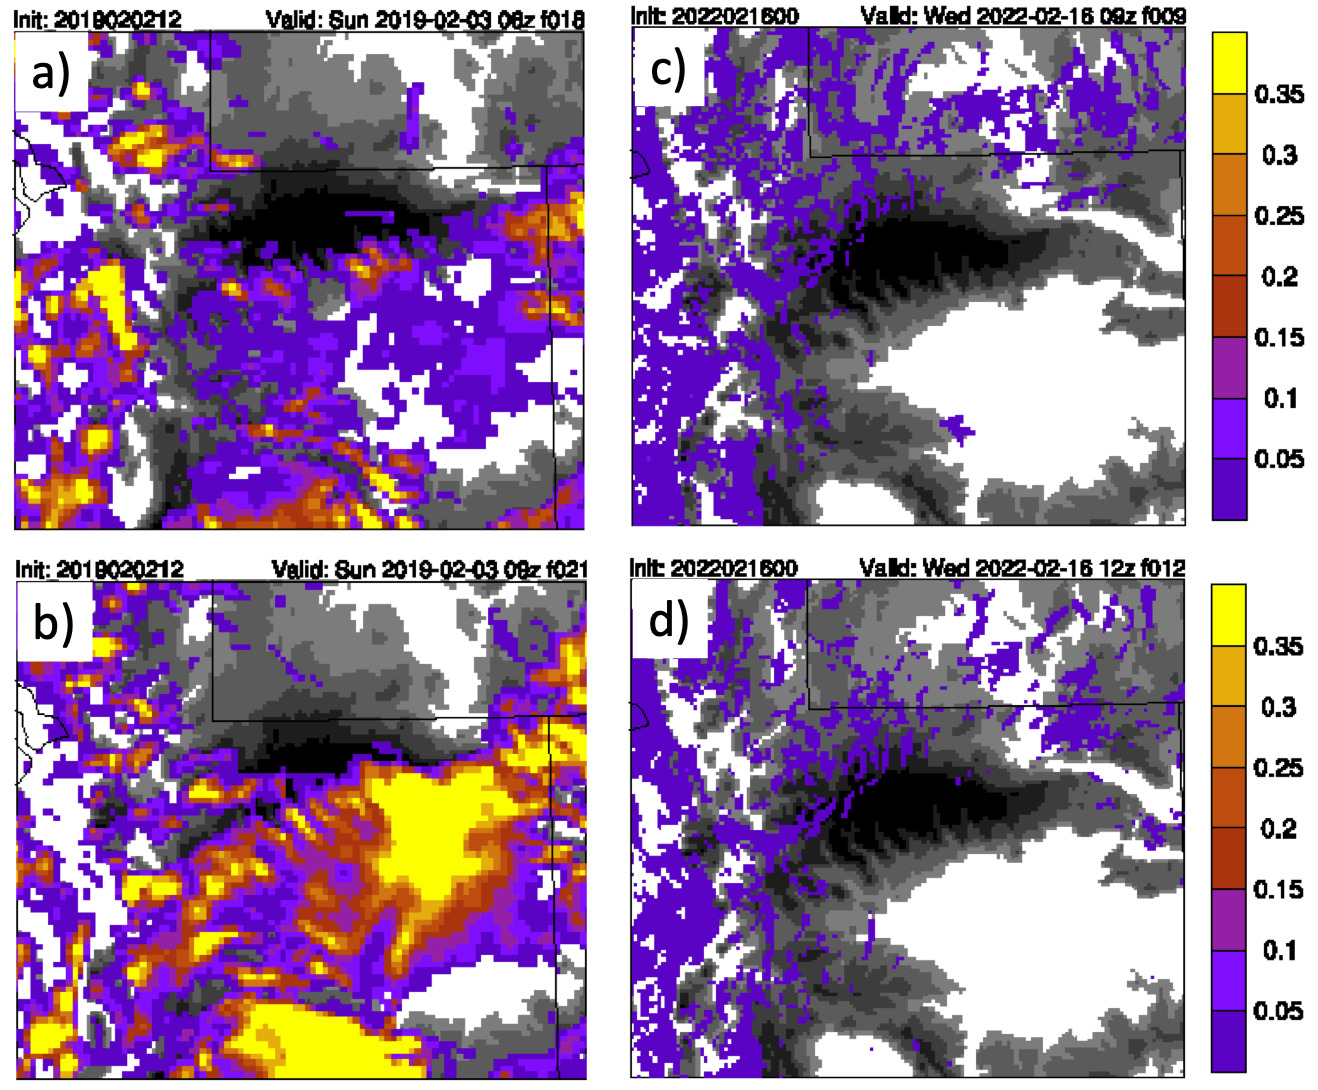
Two contrasting synoptic conditions produced distinct LWP distributions on the two sides of the mountain range, as shown in Figure 7. The southwesterly flow during the 3 February 2019 case (Fig. 7a) transported abundant moisture and generated much higher LWP, whereas the northerly flow on 16 February 2022 (Fig. 7b) resulted in very low LWP on the northern side of the Uinta Mountains. However, the WRF forecasts were not fully consistent during these events. The model overestimated LWP in 2019 and underestimated LWP in 2022 relative to the radiometer observations (Figs. 5 and 6). Similar overestimation of LWP by WRF compared to radiometer measurements was reported by Cossu et al. (2015) for Bern, Switzerland, during the summer of 2012. These results indicate that the WRF model continues to face challenges in accurately forecasting LWP magnitudes over complex terrain (Kringlebotn Nygaard et al. 2011). Chen et al. (2015) demonstrated that assimilating satellite-derived cloud products into the WRF Data Assimilation (WRFDA) system significantly improves the forecasts of LWP, as well as upper-level wind and temperature. Despite these limitations, WRF remains highly valuable in regions with sparse observational coverage, providing important guidance for icing forecasts and cloud-seeding operations, particularly where in situ observations are limited. It should be noted that this study is limited to data from only two winter seasons, and the comparison of liquid water over the two sides of the mountain range does not cover the same time periods. Longer-term and more consistent LWP observations, along with corresponding WRF model outputs across multiple mountain regions, are therefore required to robustly validate and further improve the WRF model using observational data as continuous improvement of the model is essential, and observations play a critical role in this process. Observational datasets are used not only to evaluate model performance in forecasting LW, but also to identify systematic biases and inform improvements to model physics and parameterizations. Because accurate LW forecasts are crucial for cloud seeding operations and a dense observational network is not feasible across all of Utah, the model can be effectively utilized if the forecast accuracy meets the operational requirements for cloud seeding.
_for_(a)_06z_and_(b)_09z_o.png)
5. Conclusion and Recommendation
The WRF model has demonstrated its ability to forecast LWP based on radiometer measurements. This high-resolution operational forecast model provides valuable guidance for the Uinta Range, particularly aiding in future seeding operation planning, including the optimization of seeding generator arrays.
While this study confirms the reliability of LWP forecasts, some discrepancies in magnitude were observed. Specifically, the WRF model tended to predict higher LWP values over the southern slope of the Uinta Mountains and lower values over the northern slope compared to radiometer observations. Expanding LWP measurements across different mountain ranges in Utah would support improved model testing and validation of various parameterization schemes. Furthermore, additional LWP observations would contribute to more accurate cloud seeding decisions. Future WRF simulations should be validated with increased observational data, particularly radiometer-derived LWP and temperature data. Additionally, comparing radiometer temperature profiles with observed soundings can aid in evaluating inversions.
Cloud seeding operations in Utah’s mountainous regions have a long history, and accurately identifying suitable clouds is critical for achieving positive outcomes. Improvements to the seeding program can be made through scientific studies utilizing both model and observational data. The WRF model’s ability to forecast liquid water in orographic clouds underscores its utility for seeding operations, emphasizing the importance of continued research and analysis in this field. Collaboration between the private sector (e.g., NAWC), government (e.g. Utah Division of Water Resources) and research groups (e.g. Utah State University) should persist for further research-to-operation advancements.
Acknowledgment
This research is supported by the Utah Division of Water Resources and Colorado River Lower Basin States.