


1. INTRODUCTION
Hailstorms are a frequent and damaging weather hazard in many parts of the world, particularly across the mid-latitudes. In the United States, hailstorms are more common than tornadoes, with substantial impacts on agriculture, property, and infrastructure (Lepore et al. 2018; Brown et al. 2015). Individual hailstorms can cause upwards of $1 billion USD in damage (Sander et al. 2013). The risk is especially high in agricultural regions where hailstones are less likely to melt before reaching the ground.
Hail formation begins with a small aerosol particle known as an ice nucleus (Knopf and Alpert 2023). The ice nuclei initiates freezing, resulting in “embryos,” which are frozen particles that are smaller than 5 mm in diameter (Knight and Knight 1970; Federer et al. 1982; Allen et al. 2019). Embryos can be created when raindrops coalesce and then freeze as they enter the storm’s updraft, or when descending frozen precipitation (droplets or rimed graupel) is lofted back into the updraft. As the hail embryo travels through the updraft, water, either as vapor or supercooled liquid, collects via accretion or riming on the embryo, growing the hailstone. This process typically occurs between -10 °C and -25 °C (Nelson 1983). Many factors affect the hailstone trajectories within storms, including fall speed, updraft strength, updraft size, and horizontal wind shear. Ultimately, the longer a hailstone is in the storm’s growth region, the larger it grows (Nelson 1983; Dennis and Kumjian 2017). Such growth sometimes only stops when the storm’s maximum updraft can no longer support the hailstone’s weight.
To mitigate hail damage, operational weather modification programs employ cloud seeding to introduce artificial ice nuclei to initiate earlier glaciation and alter hydrometeor development (Langerud and Moen 1998). Developing feeder cells that flank more mature cells in a multi-cellular thunderstorm often have high concentrations of supercooled liquid water which does not develop into ice until approximately -20 °C (Smith et al. 1997). The slow development of ice allows the feeder cells time to evolve and/or merge with mature cells before precipitation starts. Hail embryos remain aloft throughout this process, thus allowing for significant hailstone growth. When the feeder cells are seeded, nucleation can begin at -5 °C; thereby, enabling precipitation formation to start earlier in the cell’s life cycle and limiting hailstone development. Furthermore, cloud seeding produces more ice that results in a greater number of small hailstones as opposed to fewer large hailstones which may occur when seeding does not take place.
Synoptic-scale patterns support thunderstorm development that frequently produce hail in Western North Dakota (Frisby 1963). Therefore, Western North Dakota is a good location to study hail suppression due to its high hail frequency compared to the Upper Great Plains/Midwest region, particularly during June and July, when there is a localized maximum of cold fronts (Morgan et al. 1975). Furthermore, midlatitude cyclones are frequent in July in the Western North Dakota region (Zishka and Smith 1980). Midlatitude cyclones and cold fronts frequently initiate powerful thunderstorms, which increases hail frequency. Furthermore, geography is also important with Western North Dakota being 1000-2000 feet higher above sea level than Eastern North Dakota, which typically results in a lower freezing level. Having a lower freezing level provides less melt time for hail on descent which produces larger stones reaching the ground (Prein and Holland 2018). Furthermore, the semi-arid climate of Western North Dakota makes hail more likely due to increased evaporative cooling within the sub-cloud layer. This suggests that it is less likely that a hailstone will completely melt while falling (Syono and Takeda 1962).
Agriculture plays a central role in North Dakota’s economy, consistently accounting for 20 percent, or more, of the state’s economic base (Coon et al. 2014). The economic importance of agriculture makes the region particularly vulnerable to hail damage and can impact the livelihoods of many farmers. In fact, annual crop hail losses in North Dakota are estimated at $299 million USD (Bangsund and Hodur 2019).
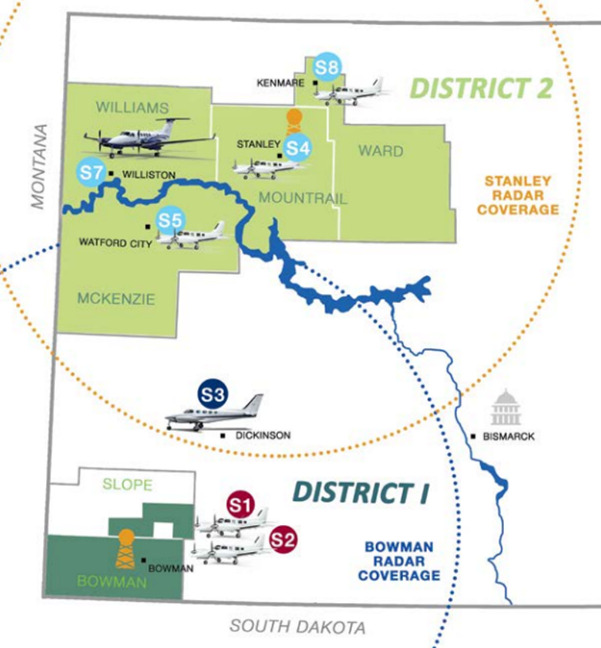
To mitigate hail losses, farmers began employing cloud seeding for hail suppression as early as the 1950s (Knowles 2020). While ground-based seeding methods were initially used, aircraft-based seeding became the preferred approach by the 1960s. The North Dakota Cloud Modification Project (NDCMP) was officially established in 1975 as a state-managed initiative (Smith et al. 1997) and has since conducted a yearly summer program. The NDCMP is run with anywhere between five and nine aircraft and two C-band radars in counties choosing to participate each year (Figure 1). The North Dakota Atmospheric Resource Board (NDARB) has designed the NDCMP to serve a dual purpose of suppressing hail and increasing rainfall (Langerud and Moen 1998). Operations are conducted to seed any cloud within the target area that meets established criteria so long as equipment and personnel are available.
Northern Great Plains precipitation usually forms as a result of cold cloud processes and tend to lack significant ice nuclei, so the NDCMP uses glaciogenic seeding materials, specifically silver iodide (AgI) and dry ice (frozen CO2) (Smith et al. 1997; Langerud and Moen 1998). Hygroscopic seeding has been tested in North Dakota through the POLCAST campaigns with positive results for precipitation enhancement (Delene et al. 2011; Delene 2016); however, glaciogenic seeding is the only operational seeding method employed by NDCMP. Glaciogenic seeding material is dispersed at cloud base and directly injected into super-cool liquid water clouds near the -10 °C level.
The remainder of the paper is organized as follows. Section 2 introduces the datasets, including radar hail diagnostics and WRF model configuration. Section 3 describes the data sets used and the methodology, including case classification, HRA output interpretation, and environmental characterization. Section 4 presents the results for individual cases and the aggregated seeded versus unseeded comparisons. Section 5 discusses the interpretation of the findings, uncertainties, and study limitations. Section 6 provides the conclusions and recommendations for future work.
2. DATA
There are three main approaches for obtaining surface hail data: numerical model simulations, ground-based observations, and empirical relationships or algorithms using remote sensing observations (Prein and Holland 2018). This study employs both radar-derived observations and numerical model simulations to better quantify the effect of cloud seeding for hail suppression.
2.1. RADAR DERIVED HAIL DATA
Dual-polarization radar data from the Department of Defense WSR-88D radar located in Minot, North Dakota, is used for case identification and incorporated into the hail detection algorithm to retrieve the observed hail size. The radar site is located at 48.39°N, -100.86°W at 455 m above sea level (Mohee 2008) and has been operational since 5 January 2001. This radar provides coverage across Western North Dakota, with a 120 km radius domain centered on the radar site. Dual-polarimetric capabilities are critical for differentiating hydrometeor types and assessing hailstone diameter. The radar covers counties both within the cloud seeding target area and outside of the target area, so both seeded and unseeded storms regularly pass in range of the radar, making it a good choice for this project. Furthermore, while most storms in the project target area are seeded, occasionally there are exceptions, allowing for a more direct comparison between seeded and unseeded storms.
The Hail size Retrieval Algorithm (HRA) builds upon foundational work in hydrometeor identification. While the Hydrometeor Classification Algorithm (HCA) developed by Park et al. (2009) reliably distinguishes between rain and mixed-phase hydrometeors, it does not provide direct estimates of hail size. To overcome this, Ryzhkov et al. (2013) conducted a comprehensive three-part study culminating in the Hail Size Discrimination Algorithm (HSDA). The HSDA employs a fuzzy-logic approach that integrates radar reflectivity (Z), differential reflectivity (ZDR), and cross-correlation coefficient (ρhv) to differentiate between no hail, small hail (<1 in), large hail (1–2 in), and giant hail (>2 in). Building on the HSDA framework, the HRA was developed to refine hail size estimation and improve applicability to operational radar datasets. The HRA is utilized in this project to accurately determine radar-indicated hail size. The HRA is composed of six vertical layers which compare the height of the radar sampling volume to freezing and melting layers. The polarimetric radar variables above are assessed within each layer to identify the hail size for each grid point within the domain. The grid spacing for these data points is 1 km times 1 km times 1 km.
2.2. MODEL DERIVED HAIL DATA
Among the modeling tools available, several methods have the ability to forecast hail size, including HailTrack (Brook et al. 2021) and HAILCAST, a one-dimensional hail growth algorithm integrated into the Weather Research and Forecasting (WRF) model (Adams-Selin and Ziegler 2016). This study utilizes the WRF HAILCAST feature to generate hail forecasts; however, these forecasts are not considered as a true observation. Ground-based observations include the use of hail pads, observer report networks, and/or economic loss reports. The Community Collaborative Rain, Hail, and Snow Network (CoCoRaHS) and the National Weather Service (NWS) both provide ground-based hail measurements. Most previous evaluations of the NDCMP have relied heavily on ground-based hail observations, which present several challenges (Jewell and Brimelow 2009; Johnson and Sugden 2014). The current network for observing hail is unreliable and the methods used for hail measurements frequently lack accuracy. In sparsely populated regions like Western North Dakota, hail reports are limited and emphasize only the largest hailstones observed. This practice raises concerns about the representativeness of the reported sizes; specifically, whether the reported size reflects the largest stone that fell, or if it accurately characterizes the entire storm event. Furthermore, because hail melts quickly after ground impact, delays in reporting can further compromise measurement accuracy. To address these limitations, this study uses a radar-based hail size retrieval algorithm to provide a more accurate measurement of hail size and distribution. This method doesn’t eliminate all bias as the algorithm is not perfectly analogous to observations and there is a model element within the algorithm. Environmental input uncertainty could bias the HRA. Model associated errors include convective intensity biases, microphysical and other parametrization assumptions, horizontal and vertical grid resolution, and storm structure sensitivity. However, all data are treated consistently and objectively to minimize the effects.
By integrating these radar-derived observations with environmental analyses and model forecasts, this study develops a robust framework to assess the effectiveness of cloud seeding in reducing hail size during the NDCMP. The research objectives involve three main tasks:
-
Evaluate the forecasted hail size potential of convective storms using severe weather indices and WRF model output.
-
Compare the forecasted hail size with the radar-derived hail size estimates.
-
Assess the effectiveness of cloud seeding in reducing hail size using a combination of modeled and observed datasets.
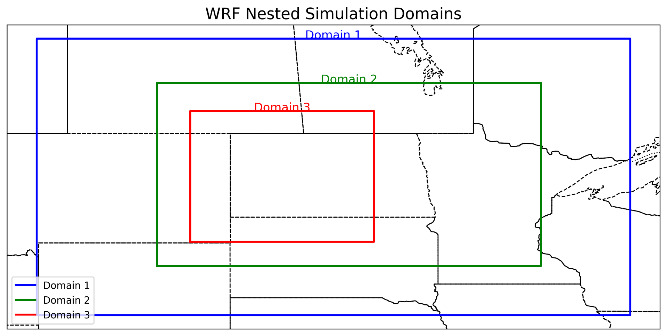
Hail forecasts are generated using archived output from the Weather Research and Forecasting (WRF) model version 3.7. model. The model employs a triple-nested domain configuration, with horizontal grid spacing of 27 km, 9 km, and 3 km, respectively. The innermost domain (3 km) focuses on Western North Dakota, allowing for high-resolution representation of convective processes. Figure 2 illustrates the location and size of each of the three domains.
_.png)
The model includes 45 vertical levels and runs twice daily, initialized at 00Z and 12Z with North American Mesoscale (NAM) data, producing 48-hour forecasts with hourly output during the convective season (1 June–31 August) (Mullendore and Starzec 2016). The WRF setup is tailored for operational support for the NDCMP and includes the HAILCAST one-dimensional hail growth algorithm that can be used to estimate maximum hailstone size (Creighton et al. 2014).
This study uses output from the WRF Single-Moment 6-Class microphysics scheme (WSM6) simulation, which has shown robust performance for Great Plains hail-producing storms (e.g., Schwartz et al. 2009; Shafer et al. 2009). All key model parameterizations for Domain 3 are summarized in Table 1. Mullendore and Starzec (2016) conducted extensive testing of this particular WRF model configuration for use in Western North Dakota and found it sufficiently represented storms in the region.
3. METHODOLOGY
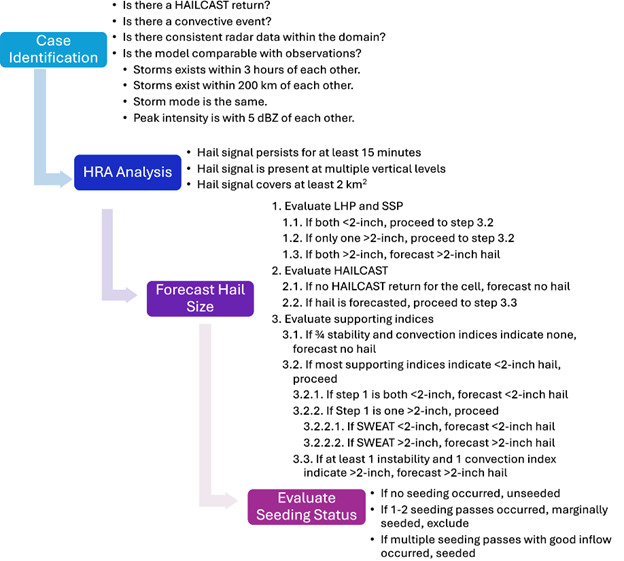
This study follows a stepwise workflow to evaluate hail-size outcomes in seeded and unseeded storm cases in western North Dakota using radar-derived hail diagnostics and WRF-based hail prediction. First, candidate storm events are identified and screened to retain cases where the modeled convection is comparable to radar-observed storms in timing and location. Second, radar data are used to diagnose hail-size categories for each case using the HRA framework. Third, the pre-storm environment is characterized using proximity soundings and key thermodynamic and kinematic parameters to document the background conditions for seeded and unseeded samples. Finally, results are summarized by comparing hail-size categories and related metrics between seeded and unseeded cases, followed by a discussion of uncertainty and limitations associated with radar hail sizing, model hail prediction, and case selection. A flowchart of the methodology along with detailed notes on each step is presented in Figure 3, with further information below.
Storm case days are selected through a multi-step process that combines model diagnostics and WSR-88D radar observations in Minot. The process begins by examining HAILCAST output from the innermost domain to identify potential hail events. Any case with a HAILCAST signature in or near the edge of the study domain is considered a candidate day and moves forward in the selection process. For each candidate day, simulated composite reflectivity fields at 2 km above ground level (AGL) are subsequently examined over the designated study region. Only cases with convective events are retained for further analysis. A convective event is deemed present if at least one coherent storm structure with sustained reflectivity values equal to or exceeding 30 dBZ for a minimum duration of 15 minutes exists. In the verification phase, these simulated reflectivity fields are systematically compared against observed radar reflectivity data to assess spatial and temporal consistency. A case is retained for further analysis only if the simulated convective system exhibits a comparable storm mode, intensity, and temporal evolution relative to the corresponding radar-observed event. Comparable events are identified as those in which the modeled and observed storms occurred within 3 hours and 200 km (~3 counties) of each other. Storm mode is identified as either supercell, squall line, or pop-up showers. If simulated reflectivity and radar data exhibit the same classification, the case is retained. Storm peak intensity between the model and radar are also compared. Maximum reflectivity needs to be within 5 dBZ of each other for the case to be retained. Examples of this case selection process are presented in Section 4.1.3. Though steps were taken to minimize biases in the selection process, biases such as operational decisions, radar range/beam height/coverage differences across the domain, model domain-edge exclusions, missing data days or incomplete radar coverage, and preferential retention of cleaner cases due to “comparability” requirement are plausible for certain cases.
Radar-observed hail size is estimated using the HRA, which assigns integer values from 0 to 3 based on polarimetric radar variables. A value of 0 indicates no hail, 1 corresponds to hail less than 1 inch in diameter, 2 indicates hail between 1 and 2 inches, and 3 denotes hail exceeding 2 inches. For consistency with the forecast classification system, HRA values of 1 and 2 are combined into a single category representing hail smaller than 2 inches, resulting in three observational categories: no hail, hail <2 inches, and hail >2 inches. These sizes represent the event-level maximum hailstone diameter within that grid cell.
The HRA is applied to the four lowest constant altitude plan position indicators (CAPPIs), which are most representative of near-surface hail size. To minimize beam broadening effects and ensure radar quality, the analysis domain is limited to a 120 km radius from the WSR-88D radar site in Minot, North Dakota, following the guidelines of Ortega et al. (2016). A hail classification is accepted only if the detected signal satisfies three quality control criteria: (1) persistence for a minimum of 15 minutes, (2) presence across at least two vertical levels, and (3) spatial coverage exceeding 2 km². Examples illustrating the interpretation of HRA output are provided in Section 4.1.1.
Proximity sounding analysis is conducted using output from the WRF model. The proximity soundings are extracted either near the time the target storm entered the domain of the study, or within two hours of convective initiation if the storm developed within the domain. When choosing between the 00Z and 12Z model runs, the simulation closest to the convection initiation is used, provided that a minimum of 10 hours of model spin-up time is achieved to ensure reliable boundary-layer development (Done et al. 2004). The location of the model proximity sounding is manually selected based on WRF-simulated maximum reflectivity, 2-m temperature, and 10-m wind speed and direction. The proximity sounding location is chosen as close to the storm as possible. The goal is to sample the near-storm inflow environment as accurately as possible while avoiding localized storm-induced perturbations. To ensure environmental representativeness, the following criteria are applied:
-
The sounding location must be outside of any convective influence.
-
The sounding location must be outside of the outflow boundary.
-
The sounding location must be in the inflow environment of the target cell.
Examples of this case selection process are shown in section 4.1.4.
The forecasted hail size for each storm is estimated using a structured, multi-parameter approach that integrates environmental indices, model-based proximity soundings, and output from the HAILCAST module within the WRF model. This methodology is developed to address limitations found in previous hail studies that relied heavily on instability metrics, particularly the Convective Available Potential Energy (CAPE), to estimate the potential maximum size of hail produced by storms (e.g., Jewell and Brimelow 2009; López et al. 2001). While CAPE is widely used as an indicator of the buoyant energy available for convection (Blanchard 1998), its relationship to hail production is not always linear or predictive. For instance, Jewell and Brimelow (2009) found that in environments with high CAPE, hail stone size was often over predicted.
Accurate forecasting of hail requires consideration of both atmospheric instability and vertical wind shear, as these two factors jointly influence storm structure and updraft strength. Typically, the most severe hail events occur in a high-instability, high-shear environment which creates a rotating updraft (the “mesocyclone” of a supercell thunderstorm). Recognizing the limitations of using instability metrics alone, several studies have incorporated other convective parameters (e.g. Marcos et al. 2021) Johnson and Sugden (2014) examined two composite parameters that integrate both instability and wind shear to improve discrimination of hail size categories. Their analysis demonstrated that the Large Hail Parameter (LHP) and the Significant Severe Parameter (SSP) exhibit skill in distinguishing storms capable of producing large hailstones (greater than 2 inches in diameter) from those producing smaller hail (<2 inches). These composite indices are designed to capture the synergistic effects of buoyant energy and vertical wind shear, thereby enhancing predictive performance. In this study, both LHP and SSP are incorporated into the hail size forecasting methodology due to their demonstrated value in identifying environments conducive to severe hail.
Johnson and Sugden (2014) investigated LHP and SSP values across various hail size categories. They found considerable overlap in index values among the smaller hail size categories, particularly between >2 in. diameter hail and <1.25 in. hail. This overlap suggests that neither LHP nor SSP, when used independently, can reliably distinguish between specific hailstone diameters. However, there is minimal interquartile range separation when distinguishing between >2 in. and <1.25 in. hail. While some overlap remains, particularly in the SSP values, the combined use of LHP and SSP has been shown to enhance classification accuracy. When used together, these indices improve the ability to differentiate between storms producing hail greater than 2 inches in diameter and those producing smaller hail. Based on the findings of Johnson and Sugden (2014), this study adopts threshold values of LHP and SSP that are above the lower quartile values of 5.8 and 28926 respectively are used to classify a storm environment as supportive of hail greater than two inches. Cases falling below these thresholds were subjected to further analysis using additional indices and HAILCAST model output to refine the forecast classification.
To enhance the classification of forecasted hail size, this study incorporates output from the HAILCAST module within the WRF model. Although HAILCAST is based on a one-dimensional hail growth framework, it provides valuable insight into the potential for hail development within convective updrafts. Given the nonlinear and three-dimensional nature of convection, HAILCAST serves as a useful tool for assessing the potential for hail rather than determining its exact size. In cases where both the LHP and SSP values fall below their respective lower quartile threshold values, HAILCAST output is used to evaluate hail potential. If HAILCAST produces output for the target storm cell, the case is retained for further analysis, under the assumption that hail is possible but not expected to exceed 2-inches in diameter. Conversely, if HAILCAST does not return any hail growth for the target cell, the storm is classified as having no hail potential.
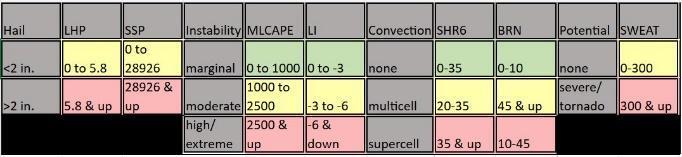
In scenarios where only one of the two hail-centric indices (LHP or SSP) exceeds its threshold (the respective lower quartile value), HAILCAST is again used to refine the classification. If HAILCAST indicates no hail development, the case is marked as having no hail potential. If HAILCAST has indications of hail, a proximity sounding analysis is conducted to estimate the forecasted hail size. Specifically, the following severe weather indices are evaluated: Mixed-Layer CAPE (MLCAPE), Lifted Index (LI), 0–6 km bulk shear (SHR6), Bulk Richardson Number (BRN), and Severe Weather Threat Index (SWEAT).
These indices include both instability and shear parameters as both are necessary for hail production. Table 2 shows color-coded values of each of these variables to represent their likelihood of producing hail greater than 2 inches. Values highlighted in green are unlikely to produce hail, yellow highlights indicate an environment is likely to produce less than 2-inch diameter hail and a possibility of the environment being capable of producing greater than 2-inch diameter hail, and red highlights environments highly favorable to produce hail with a diameter greater than 2-inches. These threshold values are adapted from operational guidance provided by the National Weather Service and established literature.
Given the range of possible index combinations across individual storm cases, the final hail classification required some level of interpretive decision-making; however, a standardized set of rules is consistently applied to ensure methodological transparency and repeatability. If at least one instability index (MLCAPE or LI) and one convection-related index (SHR6 or BRN) exceed their red threshold values, the environment is classified as supportive of hail greater than 2 inches in diameter. Conversely, if at least three of these four indices fall within the green threshold range, the storm is classified as producing hail smaller than 2 inches. In cases where most index values are in the yellow range or do not meet either above criterion, the SWEAT index was used to resolve ambiguity. A red SWEAT value indicates potential for hail greater than 2 inches, while a yellow SWEAT value supports a forecast of less than 2-inch hail.

After assessing both forecasted and observed hail sizes, each case is classified as unseeded, seeded, or marginally seeded based on cloud seeding activity. Classification relies on detailed flight logs and operational maps provided by the NDARB, which document aircraft tracks, seeding flare deployment, and inflow characteristics observed during the missions. Unseeded cases are characterized by the absence of seeding operations during the target storm’s occurrence. Seeded cases involve multiple seeding passes conducted under consistent inflow conditions. Examples of this classification are presented in Section 4.1.2.
4. RESULTS
4.1. Storm Case Analysis
4.1.1. Interpreting the Hail size Retrieval Algorithm
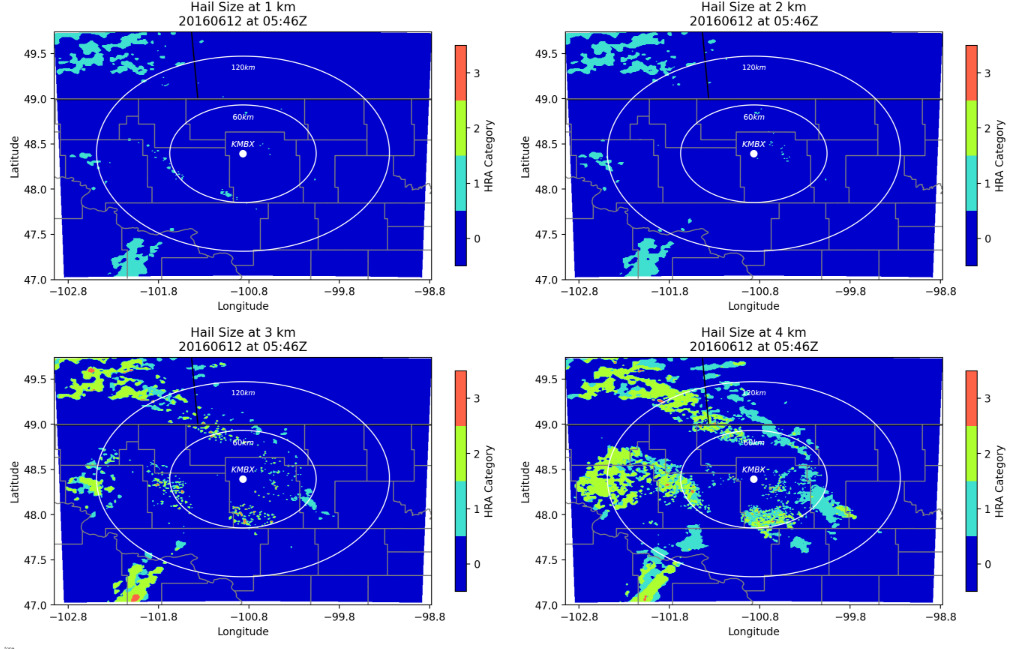
Figure 4 illustrates a case from 12 June 2016 that exemplifies hail melting prior to surface impact. At 4 km altitude, red pixels in the HRA output indicate hailstones larger than 2 inches; however, these signatures diminish with decreasing altitude. By 2 km, only sparse returns remain, and at 1 km they are nearly absent, suggesting that melting prevented large hail from reaching the ground. This case is therefore classified as “no hail” at the surface.
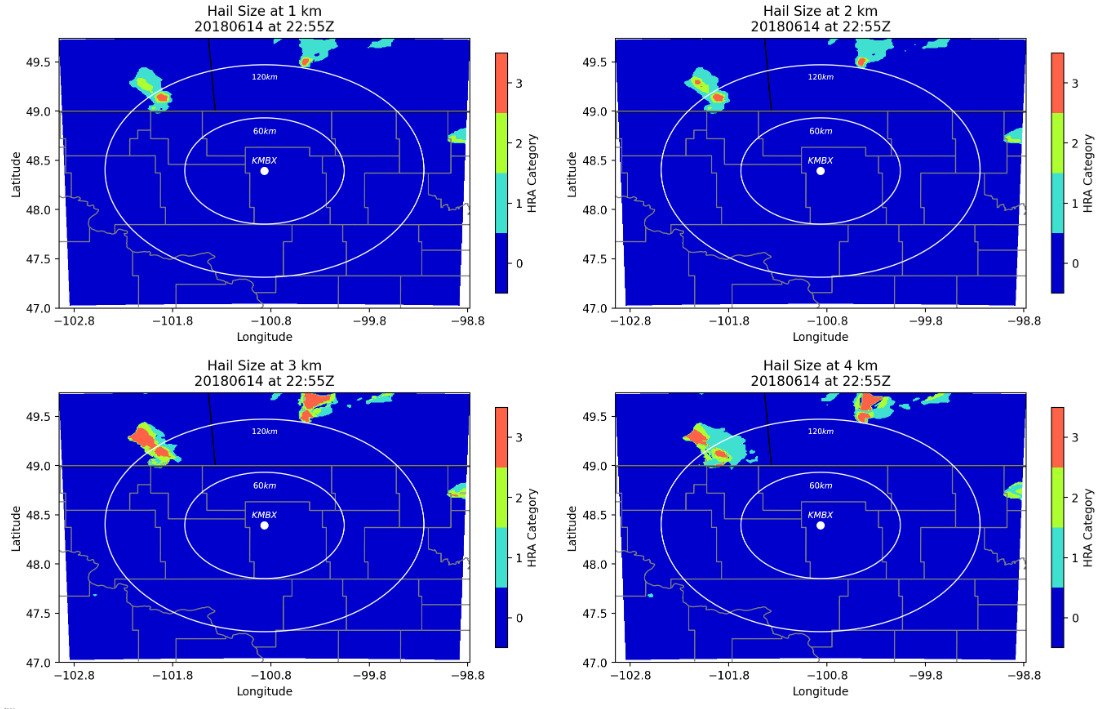
In contrast, Figure 5 shows the HRA output for the 14 June 2018 case at 22:55Z, where a supercell located northwest of the radar site in Saskatchewan produced a strong and vertically continuous signature across all four CAPPIs. Red pixel coverage near the surface confirms that hail greater than 2 inches in diameter likely reached the ground. This case is classified as “greater than 2-inch hail.”

4.1.2. Determining Seeded and Unseeded Cases
Storm seeding operations are identified using detailed pilot flight logs and maps provided by the NDARB. These records document aircraft tracks, flare deployment, and meteorological conditions encountered during flight. Storms are classified as “seeded” if multiple seeding passes were conducted under consistent inflow conditions and “unseeded” if no seeding occurred. Unseeded cases may be those which developed outside of the target seeding area or near the border where the effects of seeding would have occurred outside of the target area. Unsafe seeding conditions and suspension criteria for flash floods or tornadoes within the target area also contribute to unseeded cases. Additionally, some cases were weak enough that seeding was unlikely to have much impact. Of the 39 unseeded cases 14 originated outside of the target zone and 25 were inopportune or unsafe to seed within the target zone. Regardless of seeding status or origin location, the thermodynamic and kinematic profiles were similar across all cases. Cases with only one or two passes or insufficient inflow are designated as “marginally seeded” and excluded from final analysis. To identify which convective storms were seeded, flight operation forms and corresponding flight track maps from the NDCMP are analyzed for the summer seasons of 2016 through 2018. Out of 88 cases with sufficient model and radar data, 49 are confirmed to have been seeded based on documented seeding activities in the flight records.
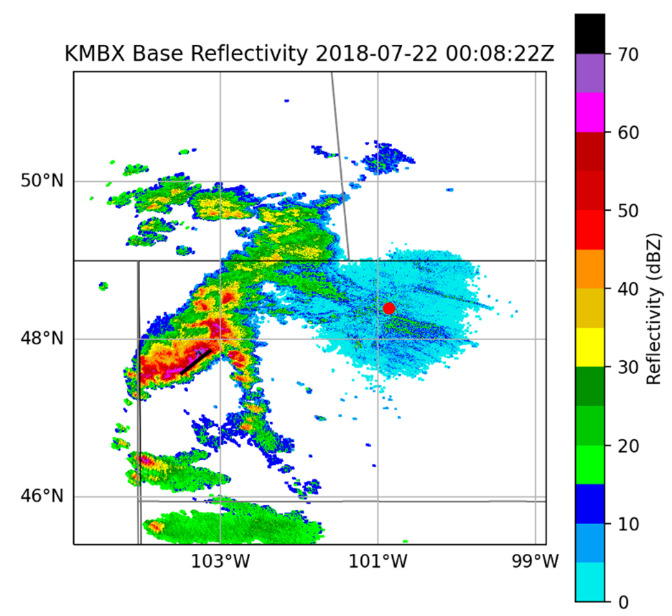
Figure 6 shows radar reflectivity overlaid with the flight track of a seeding aircraft on 21 July 2018. During this 10-minute period, both burners of the aircraft were continuously active, and one burn-in-place flare was deployed. According to pilot reports, updraft speeds exceed 700 ft min-1 for approximately 40 minutes, supporting favorable conditions for seeding. The full flight path for this case is presented in Figure 7 where the double green lines indicate times when both burners were active for hail suppression and orange dots represent the activation of burn-in-place flares for the same purpose. This storm, actively targeted by the aircraft “Seed 5” along with other project aircraft, is classified as effectively seeded. The marginally seeded cases are those where only one or two seeding passes were completed due to either poor conditions or suspension criteria. Figure 8 shows a flight map from 13 June 2016 in which only a single short segment (marked by double green lines) involved active burner use. Pilot observations during this mission indicated insufficient inflow to justify continued seeding activity. As a result, this storm did not meet the criteria for effective seeding and is excluded from the final analysis.

A total of 88 convective storm cases are analyzed over three summer seasons (2016–2018) in Western North Dakota. Of these, 49 cases are identified as effectively seeded, while 39 cases were classified as unseeded. Marginally seeded cases were excluded from the analysis to maintain a clear distinction between seeded and non-seeded events. Each case is evaluated using both forecasted hail size, derived from model-based indices and HAILCAST output, and radar-observed hail size from the HRA.
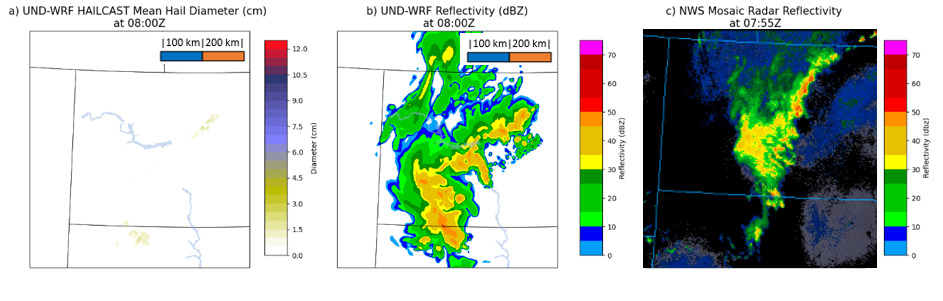
4.1.3. Storm Case Identification
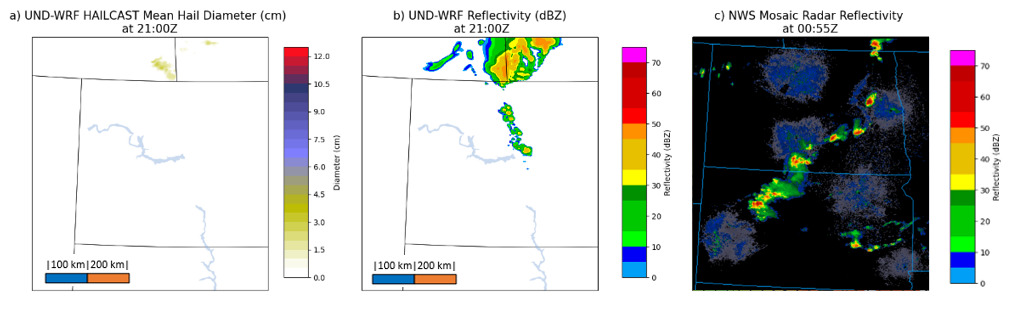
Figure 9 illustrates a representative storm case from 3 August 2018 which was marked as suitable for analysis. It presents HAILCAST output and corresponding model-simulated 2-km AGL reflectivity at 08Z, along with observed radar reflectivity data from 07:55Z. Although the observed storm formed two hours earlier than the model’s forecasted convection initiation, the model accurately captured the storm’s location, strength, and structure. Figure 10 presents similar diagnostics for the 4 August 2018 case, with model output at 21Z and radar observations at 01Z. In this case, the modeled storm initiated significantly earlier and is displaced considerably westward relative to the observed storm. Given the temporal and spatial mismatches between the simulated and observed storm evolution, this case was excluded from further analysis.
_wrf_hailcast__b)_2-km_agl_reflectivity_from_08.png)
_wrf_hailcast_output_at_21_00z__b)_simulated_2.png)
4.1.4. Proximity Sounding Analysis
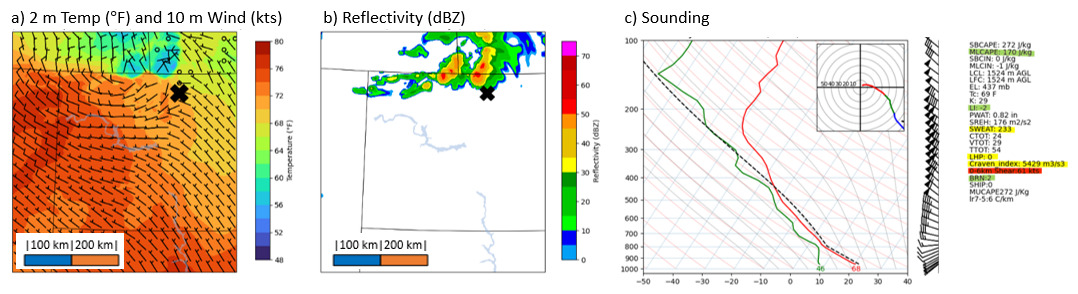
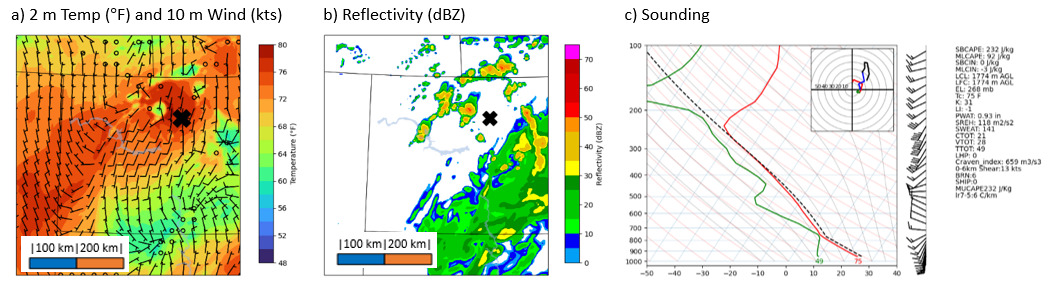
Figure 11 illustrates a representative example from 19 June 2017 at 19:00Z. Temperature, wind, and maximum reflectivity data are derived from the WRF model valid for 19 June 2017 at 19Z. The multicellular storm system is forecasted to move southeastward. The selected proximity sounding location (denoted by black “X”) is positioned downwind of the storm but sufficiently far from any convective influence to accurately represent the surrounding environment. A more complex case is shown in Figure 12 for 29 June 2017 at 19:00Z. In this case, multiple convective systems are present, including embedded convection to the southeast and a multicellular structure to the north. Due to the proximity to the edge of the model domain, the embedded system cannot be adequately sampled; therefore, the analysis focuses only on the northern system. The sounding location is strategically placed in a region with no convective influence and downwind of the target cells, satisfying all inflow criteria. For both of these cases the resulting proximity soundings are shown in Figures 11c and 12c respectively. This approach provides a consistent framework for characterizing pre-storm environmental conditions, enabling reliable comparison between forecast indices and observed hail outcomes across seeded and unseeded cases.
_2_m_temperature_and_10_m_wind__b)_maximum_refl.png)
_2_m_temperature_and_10_m_wind__b)_maximum_refl.png)
4.2. Comparison of Forecasted and Observed Hail Sizes
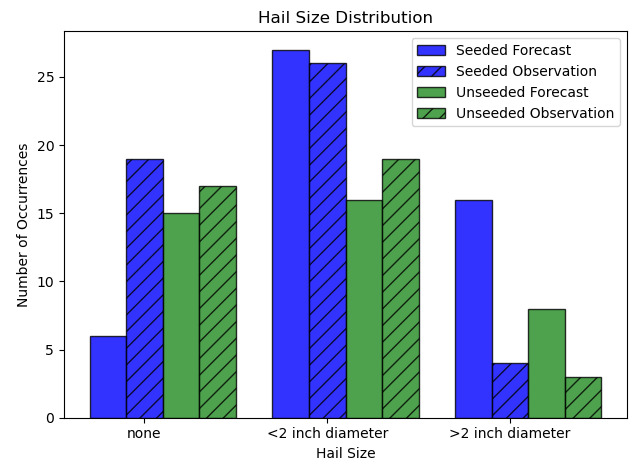
A hail size distribution analysis is presented in Figure 13, comparing forecasted hail size (blank bars) with radar-indicated hail size (hatched bars) for both seeded (blue bars) and unseeded (green bars) cases. In unseeded cases, the forecasted and observed occurrences are relatively aligned across the three size categories. On the other hand, the seeded cases exhibit notable discrepancies; specifically, the forecasted occurrences of hail in the >2-inch diameter category significantly exceeds the observations. Additionally, there is a marked decrease in the forecasted cases with no hail compared to actual observations. In Section 4.2, we compare the distribution of radar-derived hail categories between seeded and unseeded cases. We observe a shift toward smaller hail categories in the seeded sample. This pattern is consistent with a reduction in larger hail-category occurrence in seeded cases; however, because the analysis is observational and verification data are limited, the result should be interpreted as an association rather than a causal estimate of seeding impact. Despite the notable shift to smaller observed hail than what was forecasted in the none and >2-inch diameter categories for seeded cases, the <2-inch diameter category has nearly identical counts of forecasted and observed hail size. This pattern likely reflects hail suppression, whereby seeded storms that would have produced >2-inch hail instead yielded hailstones in the <2-inch threshold and storms that could have produced <2-inch hail resulted in no hail. There is a shift to one bin smaller for radar-observed hail compared to the forecasted size based on environment.
_.png)
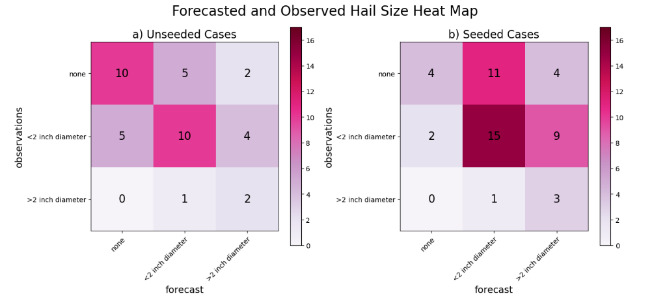
To further explore the distribution of forecasted and observed hail sizes within the <2-inch diameter seeded category, Figure 14 provides heat maps for both unseeded (Figure 14a) and seeded (Figure 14b) storm cases. Unlike Figure 13, which presents the total counts of cases per category, Figure 14 offers a more nuanced comparison by matching forecasted and observed hail diameters for individual cases. By focusing on individual cases, deeper insights into the discrepancies observed in the larger size categories are gained as well as a better understanding of the performance of the hail size retrieval algorithm during hail events. These maps visualize the match between forecasted hail size (x-axis) and observed hail size (y-axis) on a case-by-case basis. For unseeded storms, most cases cluster along the diagonal from top-left to bottom-right, reflecting strong agreement between forecasted and observed hail sizes. Notably, only two unseeded cases involved both forecasted and observed hail exceeding 2 inches, consistent with the expectation that most high-potential hailstorms are targeted for seeding. In seeded cases, the distribution shifts. Many cases still fall along the diagonal, including a pronounced concentration in the center cell, representing <2-inch hail that is both forecasted and observed. However, the next most populated cells demonstrate a shift towards the upper right corner, where observations are smaller than forecasts. This convergence supports the idea that seeded storms often produce smaller hail than forecasted, with suppression lowering hail size into the sub-severe range. The wide bin range for the <2-inch category (from pea-sized to golf-ball-sized) likely contributes to the clustering in the center. To improve the accuracy of hail size forecasting, a more refined method could enhance the differentiation of effective seeding outcomes, thereby leading to better predictive capabilities for hail events.
_39_unseeded_and_b)_49_seeded_cases._counts_of_each_bin_size_for_forecast.png)
4.3. Hail Forecast Verification and Seeding Effectiveness
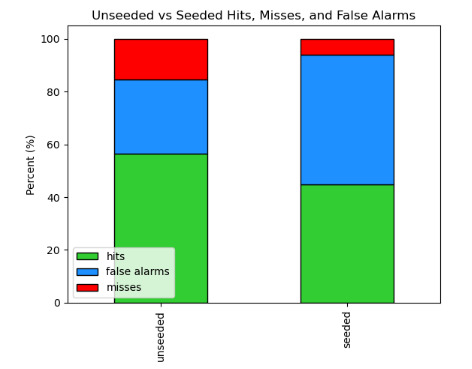
While Figures 13 and 14 characterize size distribution, they do not directly assess seeding effectiveness. To address this gap, a contingency table analysis is employed to evaluate the total effectiveness of the seeding operations. This method allows for a detailed comparison of forecasted and observed outcomes across different scenarios, facilitating a clearer understanding of how seeding influences hail size predictions. Figure 15 illustrates the ratio of hits, misses, and false alarms for both seeded and unseeded case days. A “hit” is defined as a case where the observed hail size matches the forecasted size. A “miss” occurs when the observed hail size is larger than forecasted, and a “false alarm” is when the forecasted size is larger than observed. Among the 39 unseeded cases, 56.4% are classified as hits, 28.2% as false alarms, and 15.4% as misses. This distribution indicates that the majority of forecasts accurately predict observed hail sizes. In contrast, the 49 seeded cases demonstrate a notable increase in the false alarm ratio. The hit percentage drops to 44.9%, while the false alarm percentage rises to 49.0%, and the miss percentage decreases to 6.1%. These findings reflect the impact of seeded cases in the analysis sample: in many cases, hail sizes were forecasted to be larger than what was ultimately observed, leading to a higher proportion of false alarms.
_unseeded_and_b)_seeded_cases_that_were_either_hits_(green)__false_alarms.png)
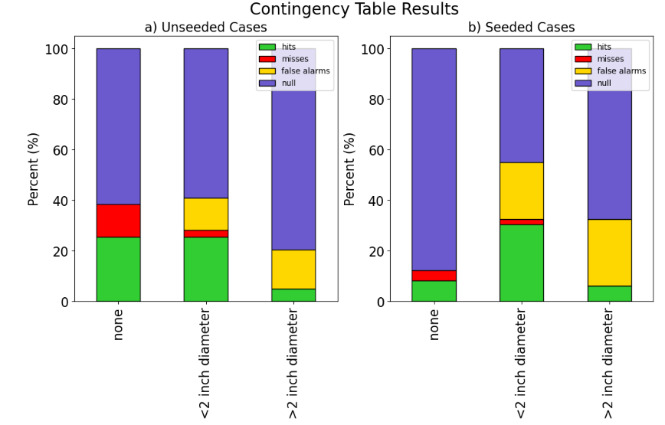
To gain further insight into how forecast performance varied across hail size categories, a bin-specific breakdown of hits, false alarms, and misses is conducted for both unseeded and seeded cases. This analysis is presented in Figure 16, which breaks down the results based on forecasted size bins for both unseeded (Figure 16a) and seeded (Figure 16b) cases. An additional category, “null,” is included to present each category on a 100% scale. Figure 16a shows the results for the 39 unseeded cases. In the no-hail and <2-inch bins, hits dominate, indicating strong agreement between forecasted and observed outcomes. However, in the >2-inch bin, there are unexpectedly more false alarms than hits. This overforecasting tendency may be attributed to biases in the WRF model, which has previously been shown to overestimate storm severity and convective strength in the Northen Plains (Mullendore and Starzec 2016). Figure 16b displays the results for the 49 seeded cases, which reveal a notable expansion in false alarms compared to the unseeded group. Specifically, in the <2-inch diameter bin, there is a 9.63% increase in false alarms, while the >2-inch diameter bin shows an 11.15% increase. These increases suggest a total 20.78% success rate for seeding operations.
_unseeded_and_b)_seeded_cases_that_were_either_hits_(green)__misses_(red).png)
5. DISCUSSION
This study provides a quantitative assessment of hail suppression during the NDCMP, leveraging a novel integration of WRF model forecasts, hail-centric indices, and radar-based hail size retrievals. Analysis of 88 convective storms from 2016 to 2018 reveals a distinction between seeded and unseeded cases. Unseeded storms demonstrate strong agreement between forecasted and observed hail sizes, supporting the reliability of the forecasting framework under natural conditions. In contrast, seeded storms frequently produce smaller hail sizes than predicted, with a notable shift of cases from the >2-inch category into the <2-inch range or resulting in no hail, consistent with the expected impacts of seeding interventions. The analysis indicates a cloud seeding success rate of approximately 20.8 percent.
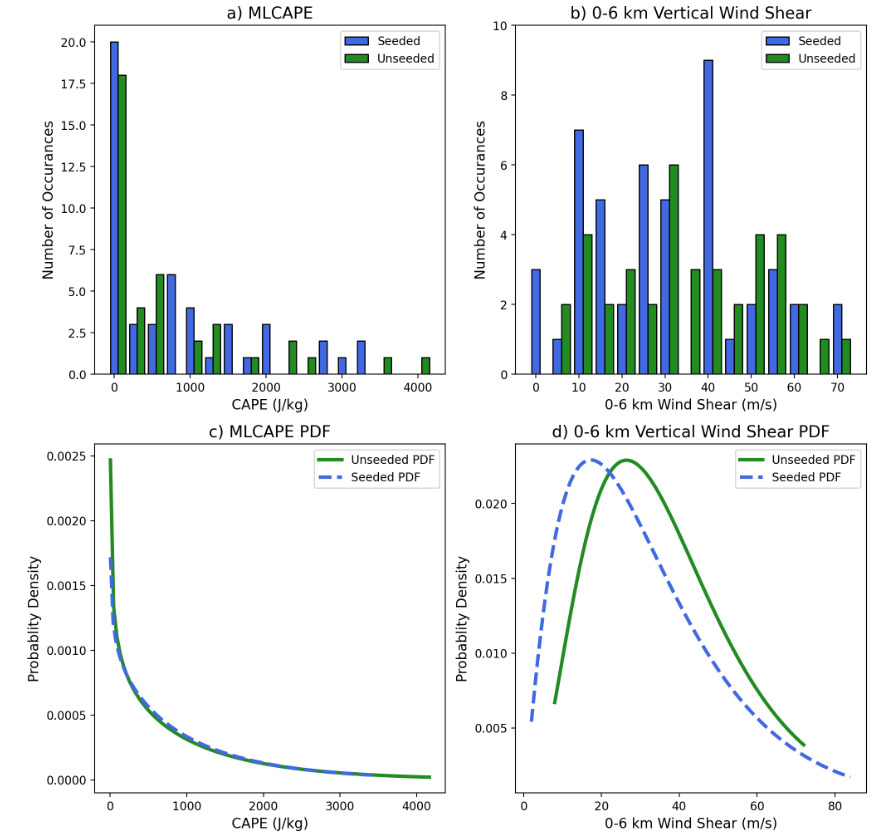
To assess whether the seeded vs. unseeded differences could be explained by environmental sampling, MLCAPE and 0–6 km bulk shear are compared across both groups (Figure 17). Both the raw counts (Figure 17a and b) and probability distribution functions (PDFs) (Figure 17c and d) are presented. The distributions for MLCAPE largely overlap; however, the PDF for 0-6 km wind shear is offset between seeded and unseeded cases. The seeded PDF shows a peak at lower shear values than the unseeded cases. Three seeded cases fall into the 0-5 ms-1 shear category, while no unseeded cases are in this bin, which likely skews the seeded curve lower. Table 3 presents other statistics for the same variables. Seeded cases show higher CAPE and lower wind shear than unseeded cases on average, but the differences are marginal. Though the values aren’t identical between the seeded and unseeded cases, there is substantial overlap, indicating thermodynamic and kinematic conditions are comparable overall; thus, the observed shift toward smaller hail and the expansion of false alarms in seeded cases are unlikely to be artifacts of environmental bias.
_mlcape_and_b)_0-6_km_vertical_wind_shear_for_each_case_included_in_thi.png)
Previous studies of the North Dakota Cloud Modification Project (Miller and Fuhs 1987; Smith et al. 1997; Knowles 2020) report 41-45% effectiveness of cloud seeding; however, it is important to recognize that these earlier estimates are derived from reductions in insurance claims, an economic metric fundamentally different from the present study’s focus on quantifying physical changes in hail size using combined radar and model diagnostics. This difference highlights an important hypothesis: although only 21 percent of storm cases in this study showed evidence of hail suppression, these particular cases might represent the most severe hail events that account for a disproportionately large share of historical financial losses. As such, effective seeding in these high-impact cases could still drive the higher economic benefits reported in prior work. Further research is needed to investigate the characteristics of successfully seeded storms and to determine whether the physical suppression rates identified here align with economic loss reductions, or if discrepancies arise from methodological differences between physical and economic assessments.
Although 20.78 percent success is not particularly high, it highlights the need for operational cloud seeding programs. Bangsund and Hodur (2019) found an annual benefit of $6.9 million USD in North Dakota counties with a seeding program, which equates to $3.00 USD per planted acre. Each cloud seeding mission has the potential for success, which contributes to the overall financial benefit. This is of particular importance in hail-prone regions such as North Dakota.
One of the primary challenges in this study is the relatively large forecast bin size, which limits categorization of hail diameter to only three classifications: none, less than 2-inches, and greater than 2-inches. This binary approach presents a significant limitation, as the HRA can differentiate between hail sizes less than 1 inch and those between 1 and 2 inches in diameter. Furthermore, uncertainties are introduced with such large bin sizes due to the stark difference between the smallest and largest hail stone included in the bin. Introducing additional forecast parameters could minimize uncertainties and enhance the model’s ability to effectively distinguish between hail sizes, particularly between those less than 1 inch and those ranging from 1 to 2 inches. This change in forecast could help produce results which align more closely with previous studies. Additionally, a predicted-sounding approach (e.g., model-based “virtual” soundings along the storm inflow, as in Marcos et al. 2021) is a valuable enhancement to pursue in future analyses to better align environmental characterization with storm timing and to support hail-size estimation.
Another challenge identified by this study is the limited number of cases. Identifying trends with limited cases allows for some uncertainties to develop. This study would significantly benefit from the inclusion of additional cases to elucidate emerging trends. This study currently relies on data collected from three summers’ worth of storms, resulting in a total of 88 usable cases. These cases were systematically categorized based on whether they were seeded or remained unseeded, creating a dataset with 39 unseeded storms and 49 seeded storms. While this dataset provides a foundation for identifying initial trends, incorporating more cases would enhance the statistical significance of the findings. More cases would allow for the identification of more certain trends. The NDCMP has been operational for over 40 years, collecting a wealth of data during this time. This extensive historical dataset holds the potential to significantly strengthen the current study, providing clearer insights into the behaviors and impacts of both seeded and unseeded storms. Utilizing these data could lead to more robust conclusions and better-informed storm management strategies.
6. CONCLUSIONS
This study has focused on three key objectives: (1) evaluating the maximum potential hail size of summertime storms, (2) comparing the forecasted hail size with outputs from the radar-based algorithm, and (3) assessing the effectiveness of cloud seeding for hail suppression during the NDCMP by examining both seeded and unseeded cases.
An integrated approach was employed, combining high-resolution WRF model output, including proximity soundings, severe weather indices, and HAILCAST simulations, with polarimetric radar-based hail size retrievals using the HRA. Given its demonstrated skill, the WRF model was confidently employed to provide the environmental context for hail size predictions and to serve as input for the HRA analyses.
The HRA was used to obtain radar-indicated observed hail size and then compared to forecasts generated by the WRF model to evaluate the effectiveness of hail suppression operations conducted during the NDCMP. Both the forecasts and observations were categorized based on hailstone diameter into three classes: no hail, hail less than 2-inch diameter, and hail greater than 2-inch diameter. A contingency table framework was used to evaluate forecasting skill and seeding impacts by classifying each case as either a miss (when the forecast is less than the observations), a hit (when the forecast equals the observations), or a false alarm (when the forecast is greater than the observations) Contingency analysis showed that while hits (matching forecasts and observations) comprised 56.4 percent of unseeded cases, they declined to 44.9 percent in seeded cases. Concurrently, false alarms, where forecasts predict larger hail than observed, rise from 28.2 percent in unseeded storms to 49.0 percent in seeded storms, indicating that seeding operations likely reduced hail sizes below forecast expectations. This translates to an estimated seeding effectiveness of ~20.8 percent, based on the increase in false alarms attributable to successful hail suppression.
While this physical measure of success is lower than the 41–45 percent reductions inferred from historical insurance loss analyses, it highlights key differences in metrics: this study provides a direct quantification of changes in hailstone size, whereas previous studies captured broader economic impacts that may disproportionately reflect the mitigation of high-damage events. It is plausible that the subset of storms effectively suppressed by seeding, though representing ~21 percent of all cases, are those most likely to have caused substantial economic losses.
Analysis of statistical significance showed a p-value of 0.079. This indicates that the results are not statistically significant at the conventional 0.05 threshold, meaning the null hypothesis cannot be rejected with high confidence. However, the p-value is relatively close to 0.05, suggesting a possible trend toward significance that might warrant further investigation. This could imply that the observed effect is real but that the current study lacked sufficient statistical power—perhaps due to a small sample size—to detect it conclusively. While the result does not provide strong evidence against the null hypothesis, it may still hold practical or theoretical relevance, and replication with a larger dataset could help clarify whether the effect is robust. At the less conventional 90 percent confidence interval, results from this study do demonstrate statistical significance.
In summary, this study demonstrates that integrating model-based diagnostics with advanced radar retrieval algorithms offers a robust framework for physically quantifying hail suppression effects of operational cloud seeding. The findings reaffirm the value of cloud seeding programs in reducing hail sizes and support continued investment in such efforts, especially in hail-prone agricultural regions like Western North Dakota. Despite several challenges, particularly the broad bin sizes for hail classification and the limited number of cases, successful cloud seeding was observed 21 percent of the time, indicating that it is a valuable program in Western North Dakota. Future work expanding the dataset to include more years of storms will provide clearer quantification of the effects of cloud seeding for hail suppression. New methods of forecasting maximum hail diameter will allow for a closer analysis of success/failure of seeding efforts.
Acknowledgements
This research was sponsored by the North Dakota Atmospheric Resource Board. Thanks to Kelli Schroeder and Paul Kucera for their help with the HRA dataset. WRF model forecasts were generated and evaluated as part of ongoing efforts to support convective storm prediction and hail suppression efforts in Western North Dakota.